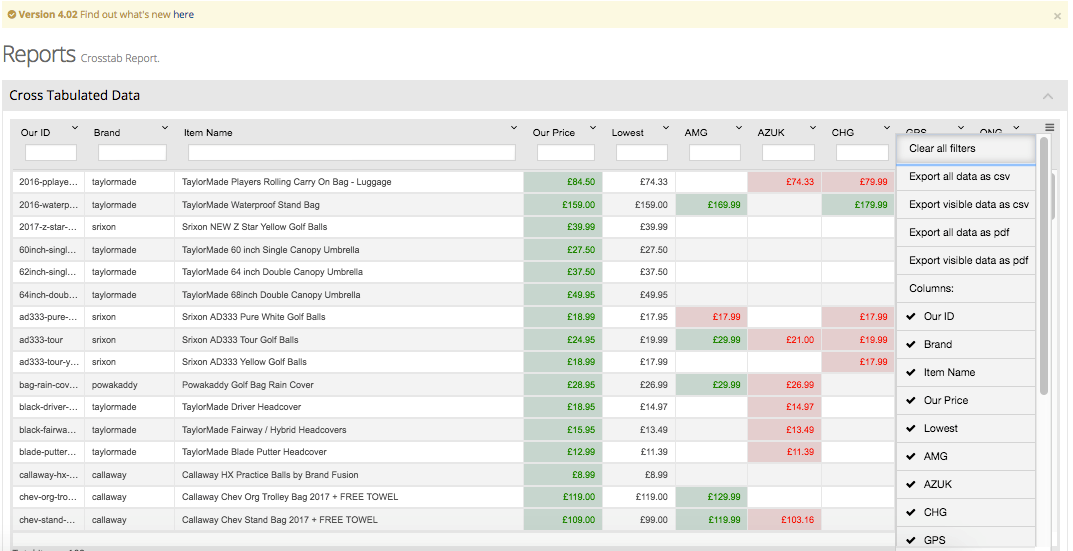
The crosstab report is a very useful report that allows users to manipulate data in a similar way to an Excel pivot table. Users can filter the report in a variety of ways. You can highlight specific categories or retailers based on any criteria you select. (Highest/lowest prices/brands/categories etc.) The user can move columns and adjust rows to view information in whatever way that is most convenient for them.