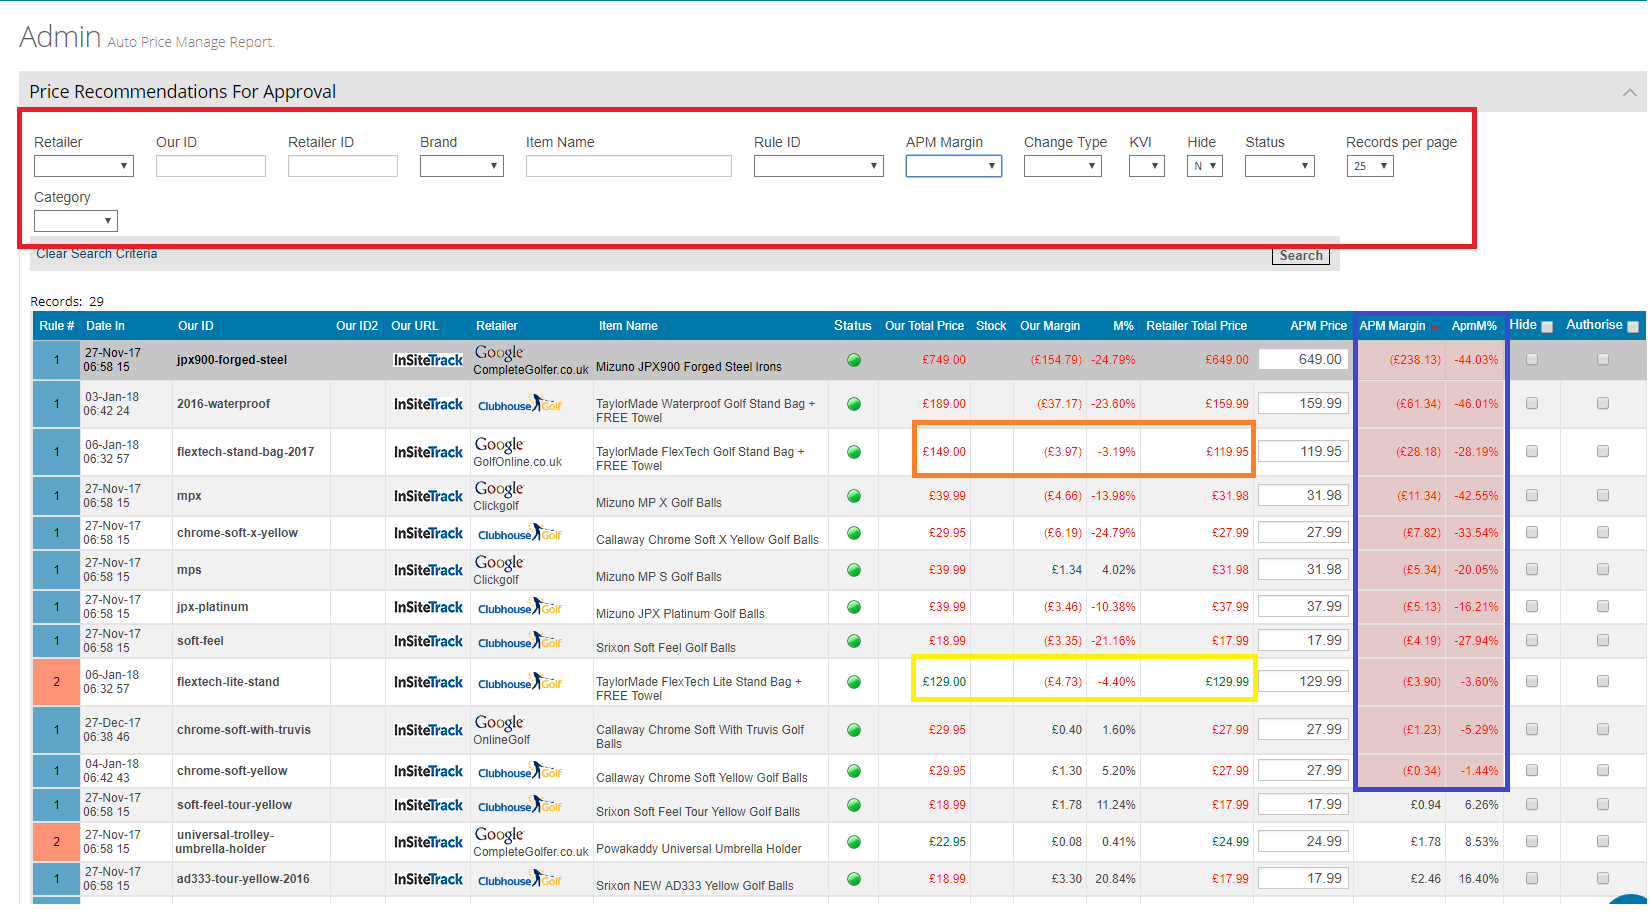
There are a few filters that you can use to sort the data in your APM report. Furthermore, there are some useful indicators, that once understood, will help with the efficiency of reading the report. Both will be covered within this article.

Similar to what you would have seen in other features of the IST system, you have multiple filter options to drill down to a specific product or type of products you are looking for (in the add matches section of this help desk you can find the using filters article). However, the APM has some that are unique to its filter fields. The Rule ID field allows you to filter by whatever products apply to the rule you pick. The APM margin field lets you sort by negative only and positive only (this will be covered below in this article). You can filter by change type, which is whether it is an increase or decrease – for example if you are the lowest price the APM might suggest an increase and vice versa if you have a higher price, it would suggest a decrease in value. The KVI stands for Key Value Indicator which is products picked by the client to be marked for importance. Finally, the last APM unique filter is the status field which can filtered by either Ok or Warning. A Warning status is typically selected by the customer if there are any conditions that causes them to be warned, for example if the margin is below a certain percent.
There are also indicators within the APM report which change the text colour of numbers and highlight the boxes within the APM margin. These format changes have different meanings, for example under the ‘our total price’ and ‘retailer price’ it is showing up as red in the highlighted orange box because the competitor has a cheaper price than ‘our total price’. In the yellow box it is in green because the price is the lowest price or it is matched with the lowest price. In the APM margin (purple box) it is highlighted in red because with the APM suggested price it will go into a negative value. For example, the first product is the Mizuno JPX900 – if the APM price was approved and implemented a £238 loss would be made on that product. This is the same principal with the percentage – if it’s a minus (negative) the loss on the example product would be -44.03%. The same indicators as the APM Margin and the ApmM% apply to the Our Margin and the M% fields. When these fields are left in grey, this means a positive as the product will be in profit.

